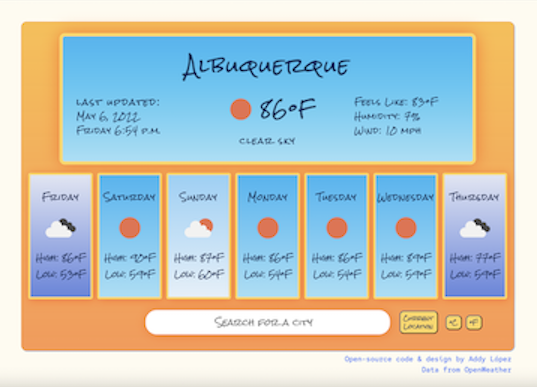
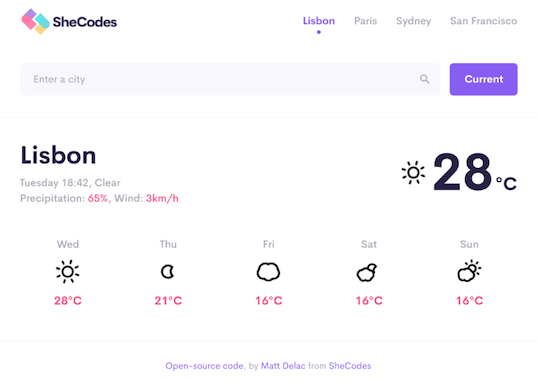
Final project submitted for the more committed SheCodes Plus workshop. It's a weather application linked to the OpenWeather API and is a dashboard capable of displaying weather data--including the current weather and the week's forecast, among other meteorological details--for over 200,000 cities around the world. I built this application with HTML, CSS, new Bootstrap techniques, and vanilla JavaScript while following a professional workflow that integrated GitHub and the hosting platform Netlify for the continuous deployment of my code.
One special feature that I want to call attention to is the dynamic, data-dependent colors that I designed for the display. Many utilitarian weather apps saturate the eye with numerical figures without visually appealing to our intuitive sense for how the days of the week will look and feel, as, for instance, when we look out the window at the sky to decide what to wear. I offer my design as a corrective.
Another deceptively simple feature to notice is the buttons I programmed. The first button triggers a geolocation function that will retrieve weather data based on the geographic coordinates of your device. The other two buttons will convert all data from Fahrenheit (imperial) to Celsius (metric) or vice versa as many times as you like without introducing errors. I am especially proud of figuring out this solution on my own, since our instructor believed that the conversion would introduce too much complexity into the assignment and did not show us how to code this feature.
As with the Masyu Project below, to illustrate my learning trajectory, I have not modified my original code. This project will not display properly on a small screen. It is best viewed on a desktop, not on a mobile device.


